
Posts Tagged ‘Weather’
John Cage’s ‘Lecture on the Weather’ (1975)
An iteration of John Cage’s 1975 ‘Lecture on the Weather’ is on display currently at Frith Street Gallery in New York with a soundscape by Maryanne Amacher. Worth dropping by if you are in the area.
At the start, Cage delivers a softly polemic prelude, and when the readings and musical realizations commence, so also begins a slowly escalating weather soundscape created by Maryanne Amacher. The work culminates with a film by Luis Frangella: Thoreau’s elemental nature drawings, now stark white on black, simulating flashes of lightning on a dark and stormy night. All of the elements — speech, music, film, lighting, and weather — combine to create a stunningly sensorial experience.
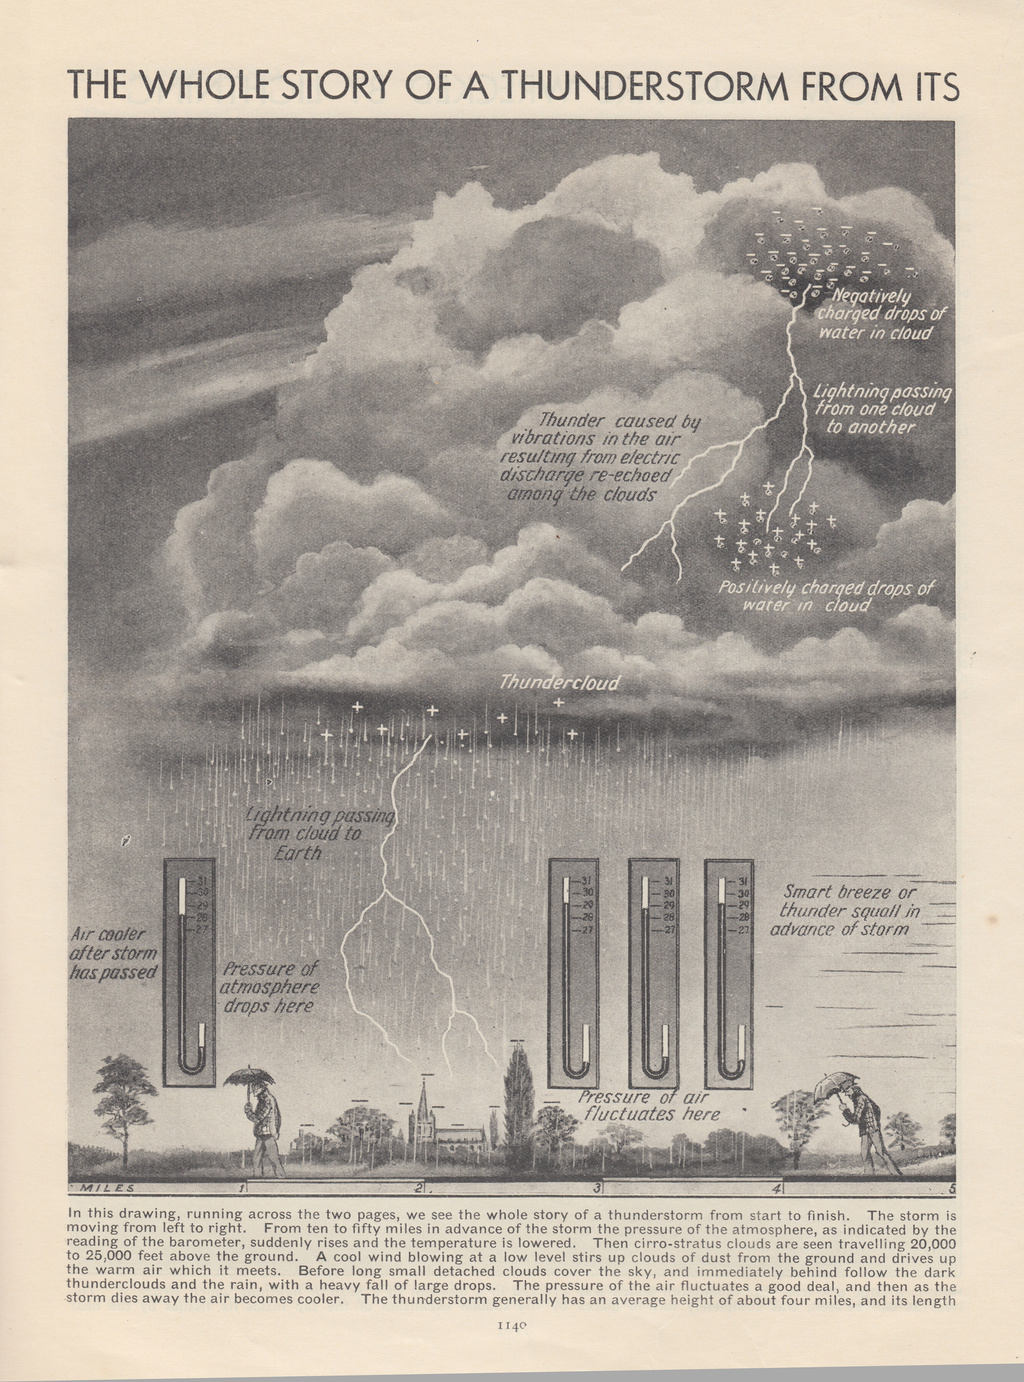
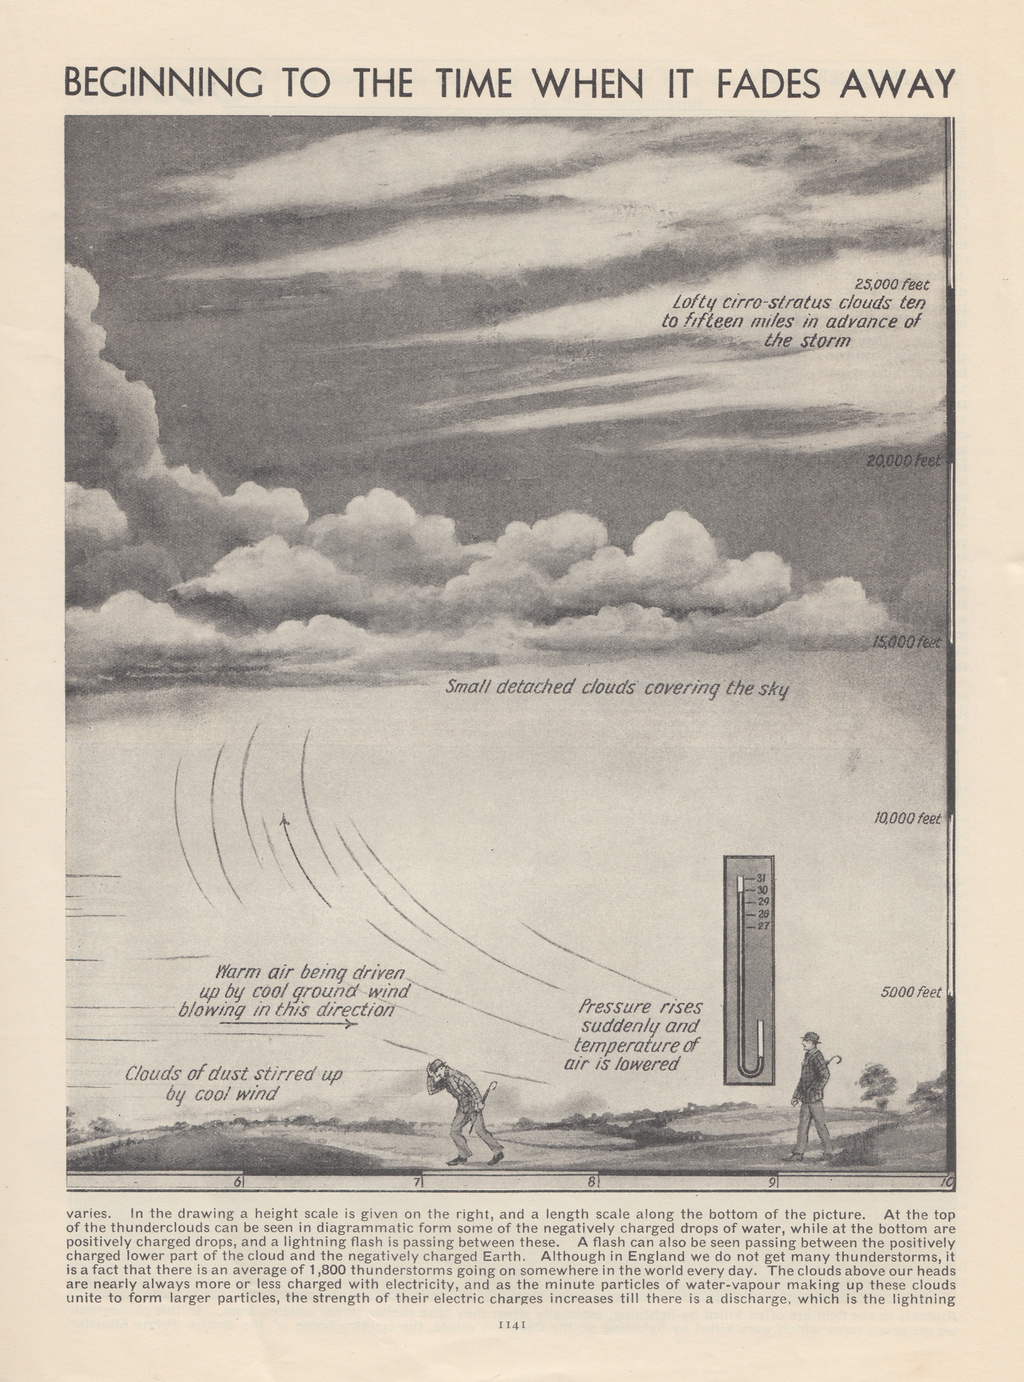
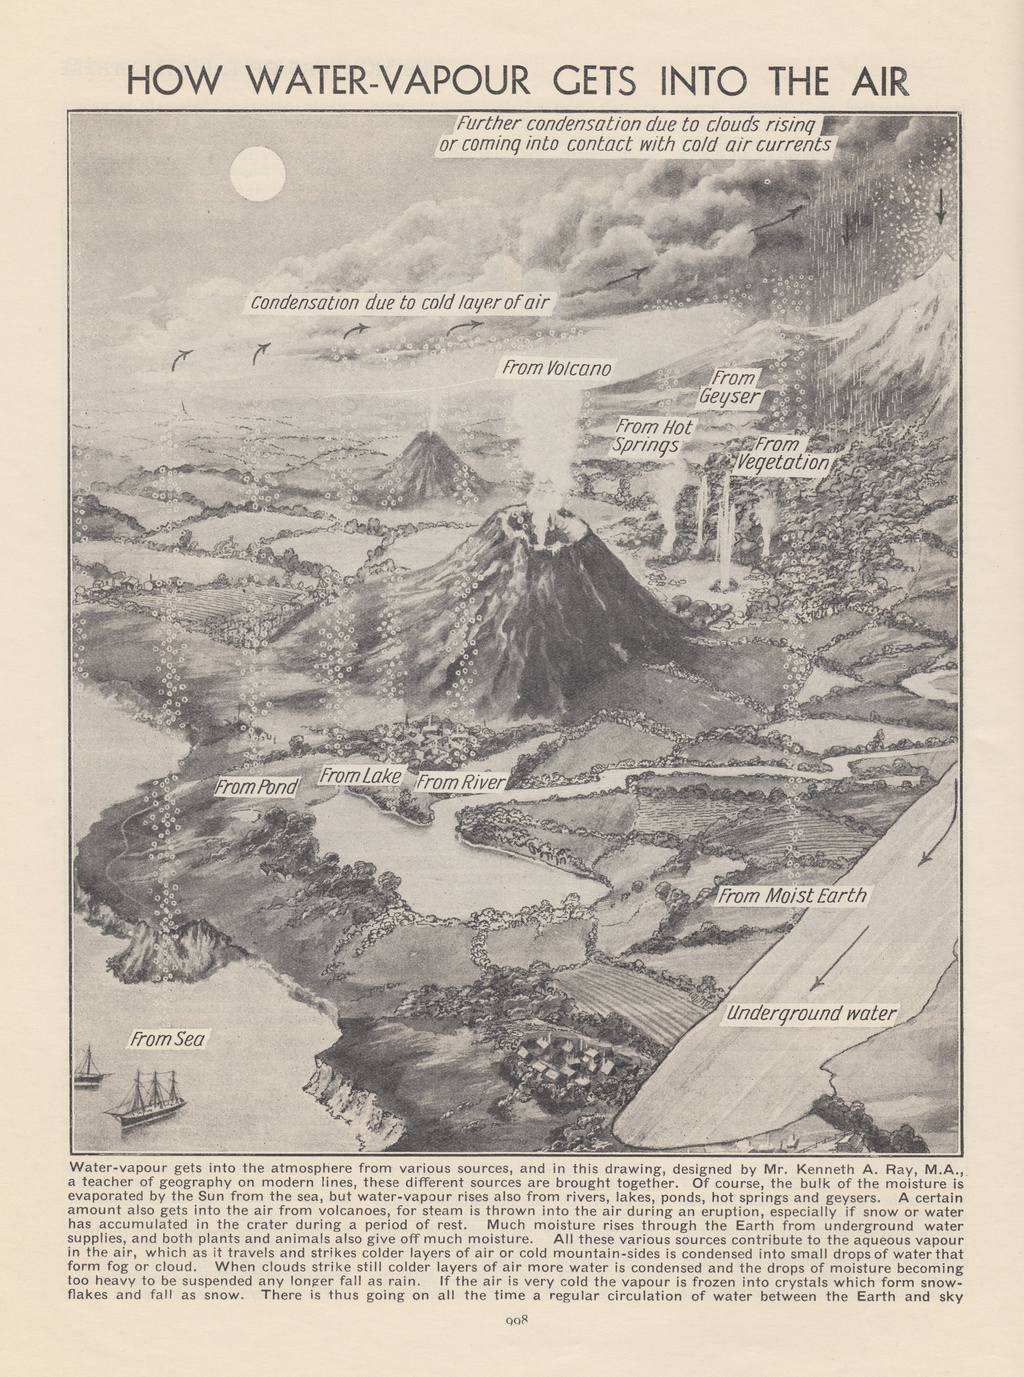
1930s Meteorological Illustrations from Popular Science Educator
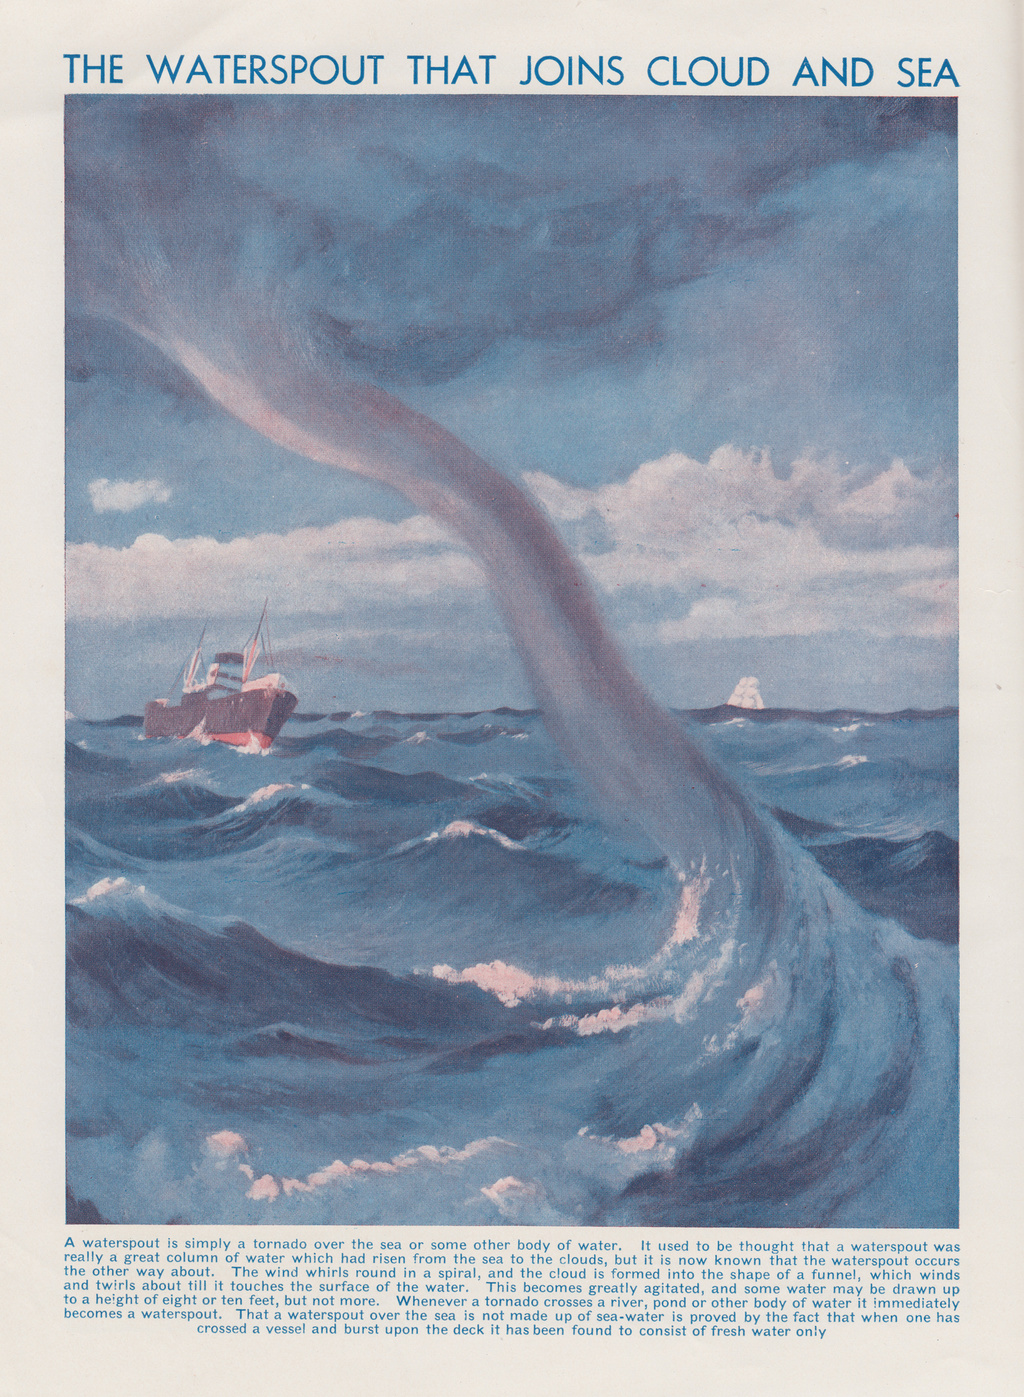
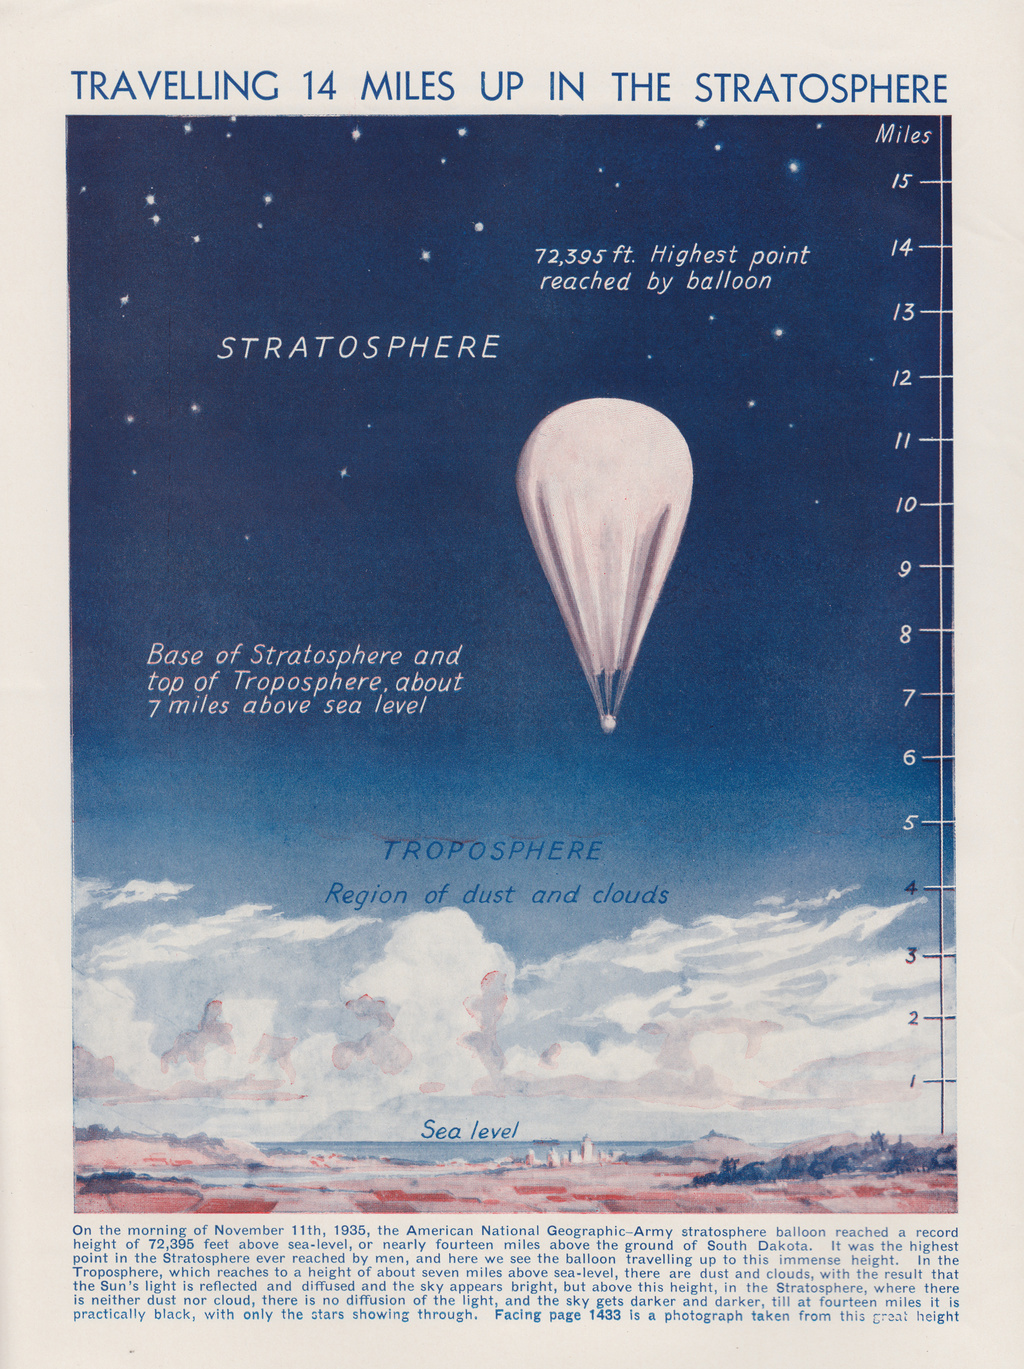
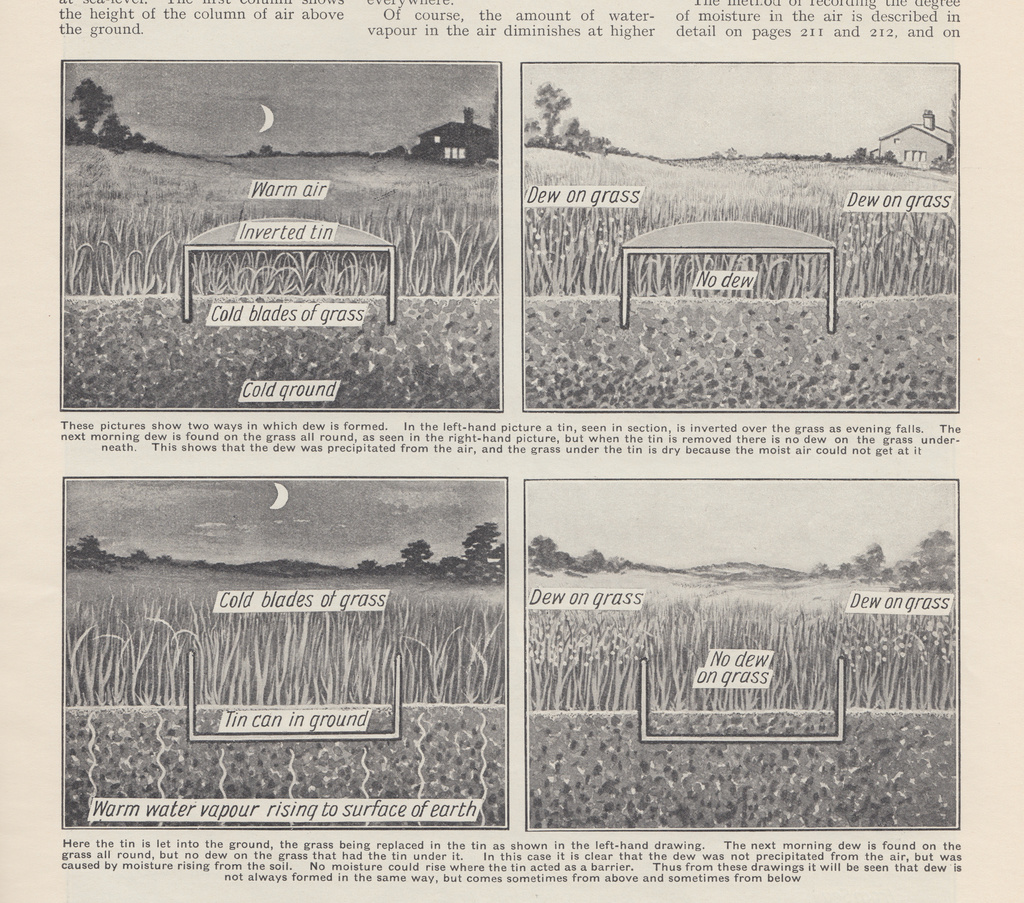
The Popular Science Editor was a long-running American periodical intended to educate children of the wonders of science. Edited by Charles Ray, who himself had no scientific training, it covers a spectrum of topics from mechanics and electricity through to geology and astronomy. Articles are frequently accompanied by marvellous illustrated diagrams, though no illustrator is typically credited.
Meteorology features heavily. Below are images from editions published between 1935 and 1936.

Global wind patterns, visualised
Earth is an interactive web-based visualisation of global wind conditions, based on readings and supercomputer forecasts of current and future weather conditions. Not only does it render this data live within the browser; it also allows for the interactive display of multiple height readings, overlays, and cartographic projection types.
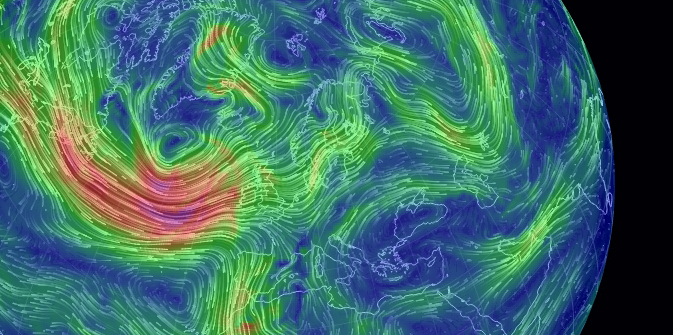
By Cameron Beccario, it’s a staggering example of the insights that interactive visualisation can give. What’s more, the code used for the data analysis and visualisation is all available on Github.
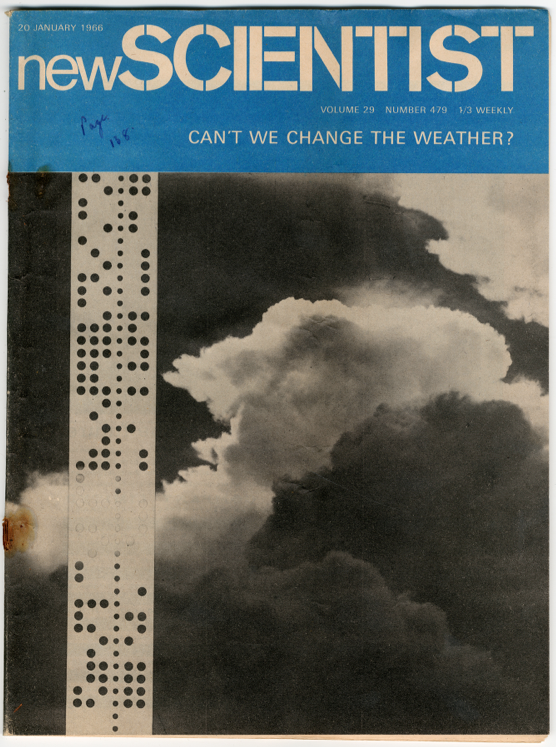
Can’t We Change The Weather?
An article from New Scientist, 20 January 1966 (click to read the article in full).
Jeremy Harding on Britain and the weather
Jeremy Harding writes in the London Review of Books on Richard Mabey’s Turned Out Nice Again and the quintessentially British fascination with the weather:
“Because of where we live, on an island in the middle of the Atlantic Storm Belt, just offshore from a huge, breathing land-mass, our meteorological lot is messy and erratic, whether we like it or not.”
the reading festival of weather, art and music, 1st-3rd june 2012 http://t.co/drk0Mjbi
Tuesday, 17 April 2012
an archive of classic meteorological papers from the royal meteorological society http://t.co/qmu93PTT
Thursday, 12 April 2012
ocean surface currents visualised over two years, using a NASA/JPL computational model https://t.co/GDEZJ8P5
Tuesday, 10 April 2012
a beautiful interactive map of wind flow across the USA http://t.co/OjSIE9rA (via @_jbag @sebemina)
Thursday, 29 March 2012
ken goldsmith, “the weather”, transcribing a year’s 1-min weather bulletins http://t.co/YwM2Hp27
Friday, 6 January 2012
mark ballora discusses data and sonification, featuring a lovely audio rendition of weather parameters http://t.co/39cAstKQ
Friday, 16 December 2011
Weather forecast
Snape Maltings weather forecast for today: something for everyone. The ideal conditions for Variable 4.

BWS-200 weather station details


Weatherspark
In preparation for next month’s Faster Than Sound, we’ve been doing some analysis of the local area’s weather data from past years, to gain some insight into what the conditions are likely to be on the day. The gratifying part of this is producing graphical visualisations of weather patterns, which can often be aesthetically beautiful as well as useful for understanding underlying structure.
Here are a couple from last year’s research at Dungeness, representing the distribution of wind direction over a month:


In looking into online approaches, we came across Weatherspark, which is an incredibly full-featured tool to look into current and historical meteorological trends around the world. It includes data from a weather station not too far from Aldeburgh, and can be filtered by numerous attributes: wind speed and direction, sun hours, temperature, dew point, humidity, precipitation, and more.

It allows data from different stations to also be compared, and – in a really nice feature – generates written weather forecasts for any given day. Check it out for May 28th.
Weather data #3: Wind direction through May 2009
Thanks once again to the impressive archival of Romney Marsh Weather, here’s a third plot of wind direction data: this time, on a 5-minutely basis, through the entirety of May 2009.

All of these plots have been created with the invaluable R toolkit, with ggplot2 and circstats for polar plots.
Weather data #2: Wind direction
As a followup to our earlier post on weather data from Romney Marsh, here’s a quick circle plot of the wind direction over the same time period (30 April – 6 May 2010).
It seems to tally pretty closely with the Met Office commentary on southern wind patterns: prevailing south-westerlies from the passing Atlantic depressions, alongside seasonal winds from the north-east due to high pressure over Scandinavia.

Romney Marsh Wind Direction, w/e 6 May 2010.
Data: Romney Marsh Weather
Weather data


")
