Posts Tagged ‘Graph’
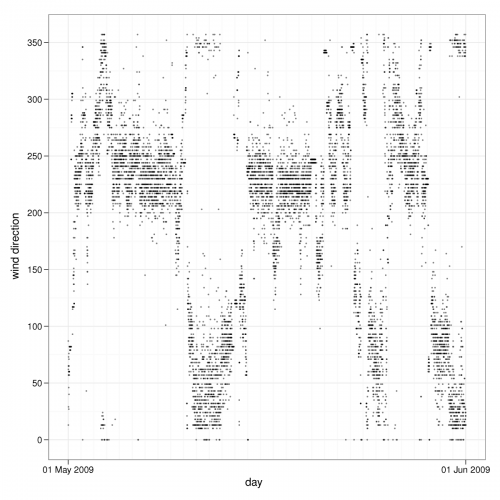
Weather data #3: Wind direction through May 2009
Thanks once again to the impressive archival of Romney Marsh Weather, here’s a third plot of wind direction data: this time, on a 5-minutely basis, through the entirety of May 2009.
All of these plots have been created with the invaluable R toolkit, with ggplot2 and circstats for polar plots.
Weather data #2: Wind direction
As a followup to our earlier post on weather data from Romney Marsh, here’s a quick circle plot of the wind direction over the same time period (30 April – 6 May 2010).
It seems to tally pretty closely with the Met Office commentary on southern wind patterns: prevailing south-westerlies from the passing Atlantic depressions, alongside seasonal winds from the north-east due to high pressure over Scandinavia.
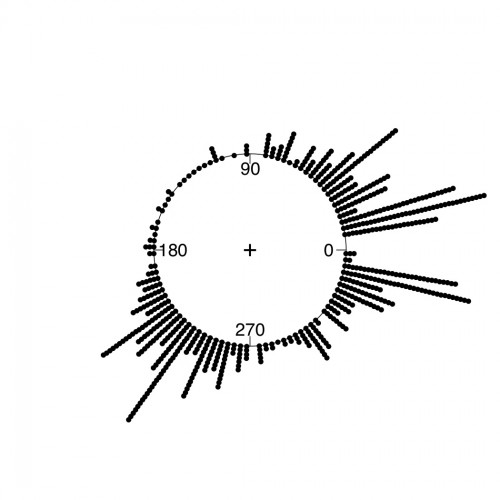
Romney Marsh Wind Direction, w/e 6 May 2010.
Data: Romney Marsh Weather

