
Posts Tagged ‘Wind’
Global wind patterns, visualised
Earth is an interactive web-based visualisation of global wind conditions, based on readings and supercomputer forecasts of current and future weather conditions. Not only does it render this data live within the browser; it also allows for the interactive display of multiple height readings, overlays, and cartographic projection types.
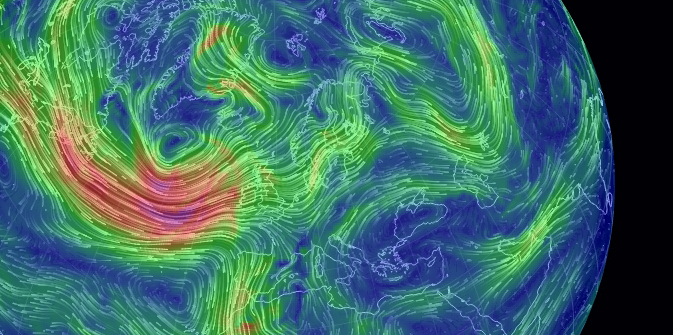
By Cameron Beccario, it’s a staggering example of the insights that interactive visualisation can give. What’s more, the code used for the data analysis and visualisation is all available on Github.
a beautiful interactive map of wind flow across the USA http://t.co/OjSIE9rA (via @_jbag @sebemina)
Thursday, 29 March 2012
wind (2008), a sound sculpture that responds to wind patterns in the viewer’s visual field, by @damian0815 http://t.co/yYUsNMcV
Sunday, 18 March 2012
windswept (2012), a wind-driven kinetic façade indicating the direction of windflow over the surface of a building http://t.co/76hs5PHt
Wednesday, 14 March 2012
weather station (norbert schnell & robin minard, 1995) uses climate sensors and 310 piezos for weather-reactive sonics http://t.co/bJlglbBr
Tuesday, 21 February 2012
Wind Knitting Factory
Here in our headquarters inside the Variable 4 windmill, we keep an ear to the ground for innovative and engaging weather-related artworks. We’re putting together a collection to publish shortly, but in the meantime, we couldn’t resist mentioning this piece. Merel Karhof’s Wind Knitting Factory is a mechanical device which harnesses wind power to produce a neverending scarf, which is occasionally harvested to produce wearable garments.


In a charming touch, the product is linked to the process with a label indicating the date and time taken to knit each garment.


The group’s blog includes a collection of images of urban windmills, and an adaptation of the idea into wearable brooches which convey the air movement created when the wearer moves around.
More:
- Merel Karhof
- Platform Two (RCA)
Weather data #3: Wind direction through May 2009
Thanks once again to the impressive archival of Romney Marsh Weather, here’s a third plot of wind direction data: this time, on a 5-minutely basis, through the entirety of May 2009.

All of these plots have been created with the invaluable R toolkit, with ggplot2 and circstats for polar plots.
Weather data #2: Wind direction
As a followup to our earlier post on weather data from Romney Marsh, here’s a quick circle plot of the wind direction over the same time period (30 April – 6 May 2010).
It seems to tally pretty closely with the Met Office commentary on southern wind patterns: prevailing south-westerlies from the passing Atlantic depressions, alongside seasonal winds from the north-east due to high pressure over Scandinavia.

Romney Marsh Wind Direction, w/e 6 May 2010.
Data: Romney Marsh Weather
Weather data


")
